


Energy Eats Intelligence:
Power Generation
What AI’s energy appetite will cost, which technologies can supply it, where they can be built, and how soon.
Prime Movers Lab and Roger Carter
June 2026
In September 2024, Microsoft agreed to buy the entire output of a nuclear reactor in Pennsylvania for the next twenty years. Three Mile Island Unit 1 had been shut down in 2019 because it couldn’t compete with cheap natural gas. Microsoft was paying to bring a dead plant back to life — all 837 megawatts of it — and agreed to wait until 2028 to receive the first kilowatt-hour.
Why would one of the most careful buyers in the world pay a premium for power it cannot use for four years? Because the constraint that matters for artificial intelligence is no longer just the supply of chips, capital, or engineers. It’s electricity, and in particular “firm” electricity; the kind that runs day and night regardless of weather. Microsoft is not alone in securing these deals. Meta has optioned 6.6 gigawatts of nuclear capacity before a single advanced reactor has come online, and every hyperscaler has aggressively pursued deals for compute, with several well-funded startups seriously proposing to put data centers in orbit, where the sun never sets and no one waits in an interconnection queue.
This paper asks how much electricity the AI build-out will actually require, which technologies have a real chance of supplying that demand, where they can be built, and whether we can deliver it in time.
1. How bad is it, really?
Suppose you wanted to know how much electricity the world will use in 2050. The natural thing to do is to collect the major forecasts — from the International Energy Agency, the U.S. Energy Information Administration, BloombergNEF, Wood Mackenzie, and a few others — and split the difference. We did exactly that when we started. Then we read each forecaster’s back catalog, edition by edition, and concluded that the average was worse than useless.
There are two problems with it. The first is that some of these are not electricity forecasts at all. Three of the nine outlooks we began with — from OPEC, BP, and ExxonMobil — are really oil-industry-centric documents; they either don’t publish a comparable global electricity number or fold data-center demand into a single line of general economic growth. Averaging them into an electricity forecast is like asking your dentist to weigh in on knee surgery. He may have opinions, but they don’t belong in the consult.
The second problem is that averaging cancels error only when the errors point in different directions. If some forecasters run high and others run low, the mistakes wash out, and the middle is informative. That’s not the situation here. These forecasters tend to miss in the same direction, for the same reason: they wait for new demand to show up as committed government policy or filed utility paperwork before they will put it in the model. When demand is driven by private capital moving faster than either — which is exactly what is happening — the forecasts lag together.
Solar power is the cleanest illustration. In 2010, the IEA projected that the world would install 294 gigawatts of it by 2030. We passed that level in 2016, fourteen years early. The 2015 edition’s projection for 2050 was passed in 2023, twenty-seven years early. This wasn’t bad luck; it was a structural feature of how the models were built. Average a group of forecasters who are all consistently late, and you do not get the right answer. You get a late answer with a respectable-looking error bar around it.
So we set the average aside and estimated demand two ways that do not depend on each other. The first is top-down: take each forecaster’s current numbers and correct them by how much that same forecaster has historically had to revise its own past projections. The second is bottom-up: ignore the forecasters entirely and add up what the operators are actually building — every disclosed power-purchase agreement, every reactor restart, every behind-the-meter gas plant a hyperscaler has announced.
The two methods are worth comparing precisely because they were built from different raw materials. On total global electricity demand in 2030, they land within about 3 percent of each other, at roughly 37,500 terawatt-hours. When two independent estimates agree that closely, it is reasonable to treat the number as a floor and move on.
On data centers specifically, they do not agree. Our bottom-up estimate puts 2035 data-center demand about 77 percent above the IEA’s base case: 2,125 terawatt-hours against 1,200. The reason isn’t that one of us is bad at arithmetic; it’s that the operators are signing contracts for power years before the institutional models expect to need it, and those models, by construction, cannot see a commitment until it has worked its way into the official statistics. We think the hyperscalers and operators are the better guide to the near term, for the simple reason that they are the ones writing the checks.
However, our bottom-up number rests on announced plans, and announced plans get cancelled. If AI investment slows, or if a more efficient way to train and run these models cuts the electricity required per unit of useful work — the kind of jump the field saw with DeepSeek in early 2025 — then our estimate is too high, and the institutional forecasts will look prescient. We think the risk runs the other way, toward more demand rather than less, because every efficiency gain in computing history has been met with more computing rather than less. Cheaper computation has so far been met with more of it, not less (Jevons Paradox) The demand that’s sure is the kind that comes from verifiable work: code that compiles, problems with a checkable answer, where the value is already proving out. What’s less certain is whether AI proves broadly useful across the messier, unverifiable parts of the economy. We believe that it will, but anyone who tells you this question is settled is overselling.
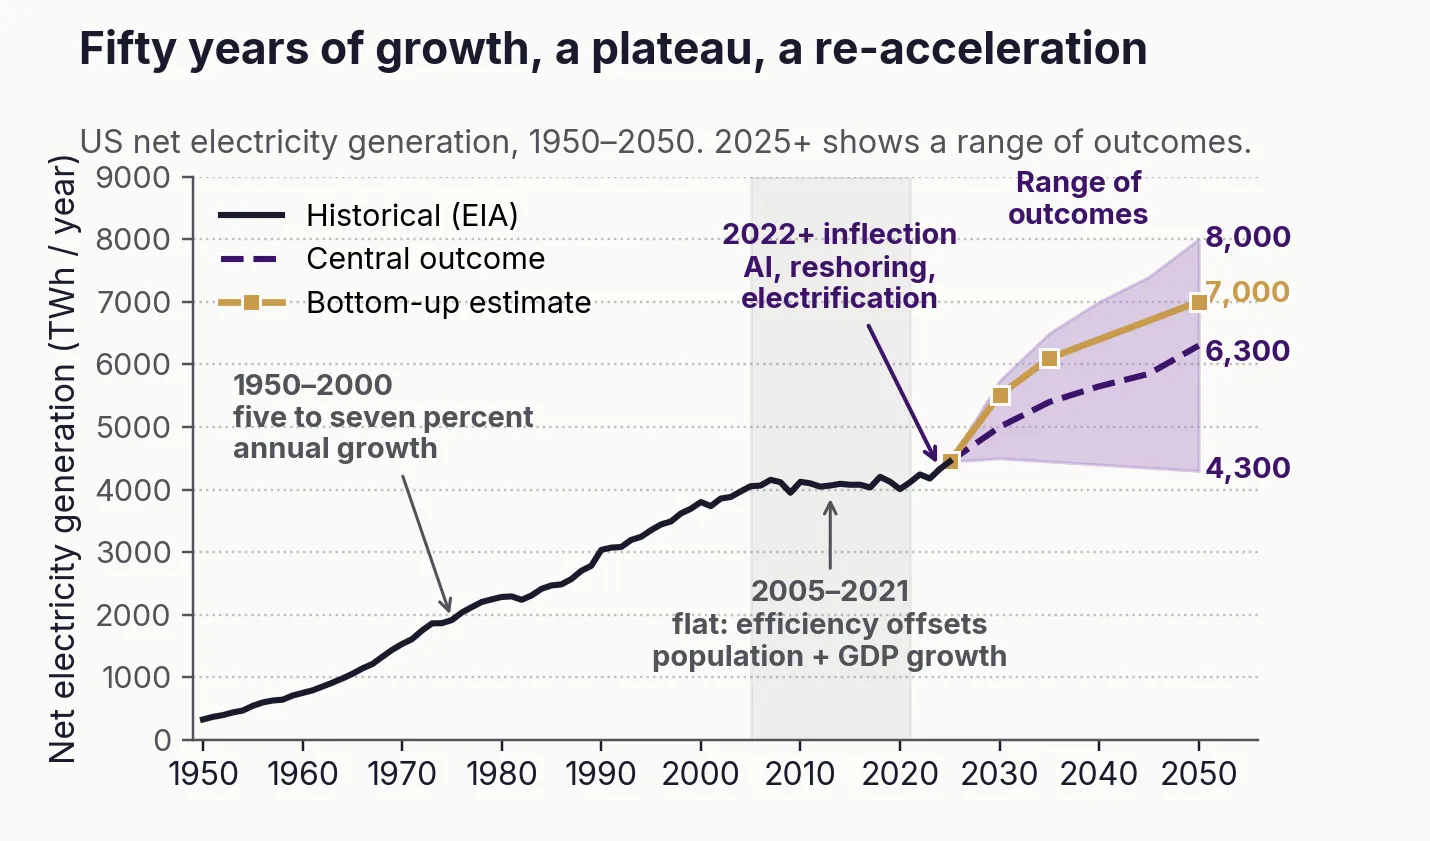
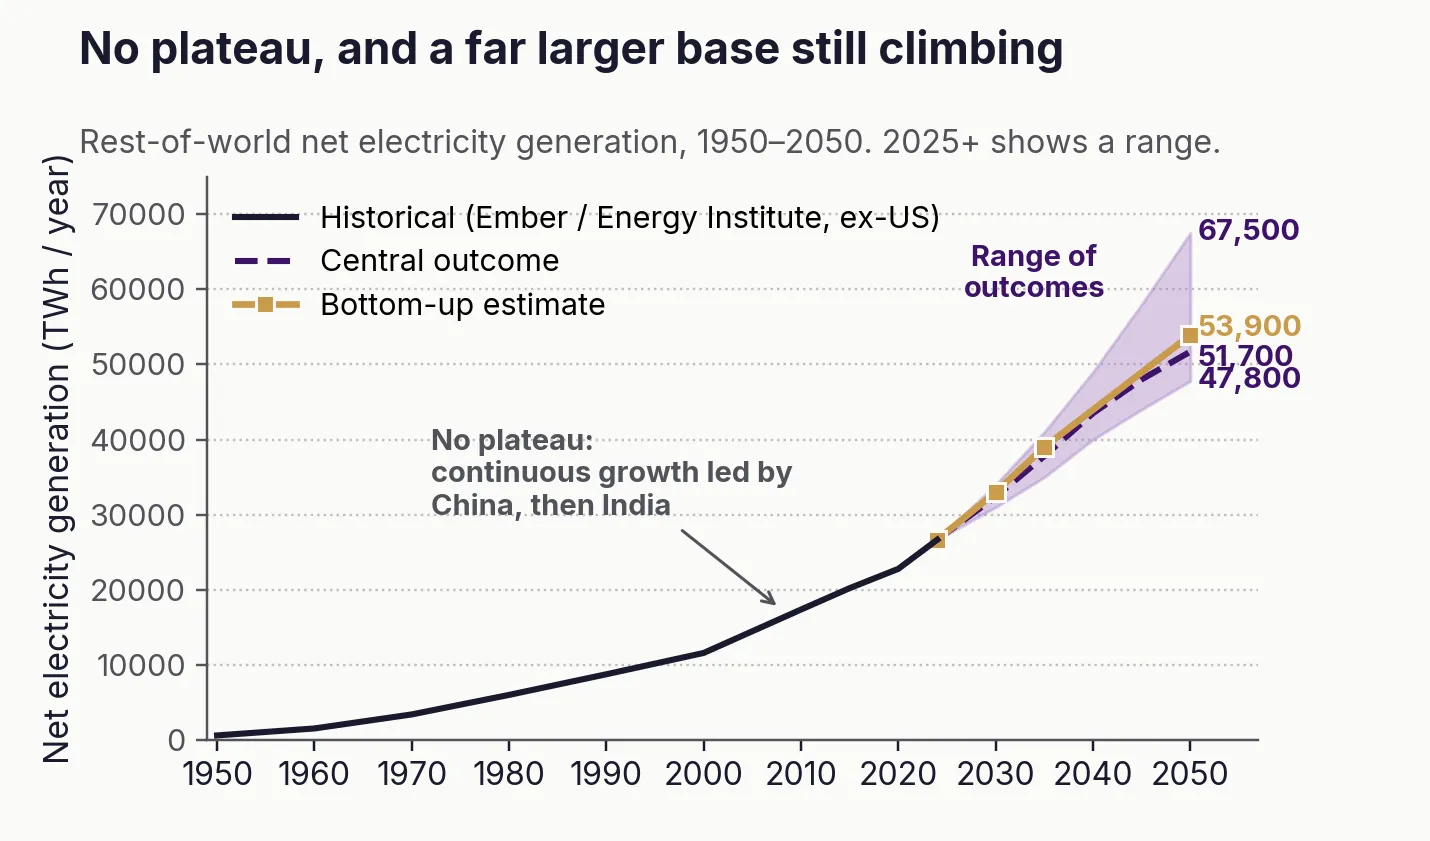
The US picture has a history worth examining. Until the mid-1970s, US electricity demand grew faster than GDP, as the economy electrified. From the 1970s to the mid-1990s the two moved in lockstep. After the mid-1990s, demand growth fell below GDP and stayed there until 2024 and 2025, when it turned up again. The plateau the figures below show is the breaking of a thirty-year pattern.
2. Can we meet the near-term demand?
Knowing how much power you need and being able to deliver it are different problems, and the second one is harder. The demand we’ve described arrives in the next few years, and the question is what can be physically built on that timeline.
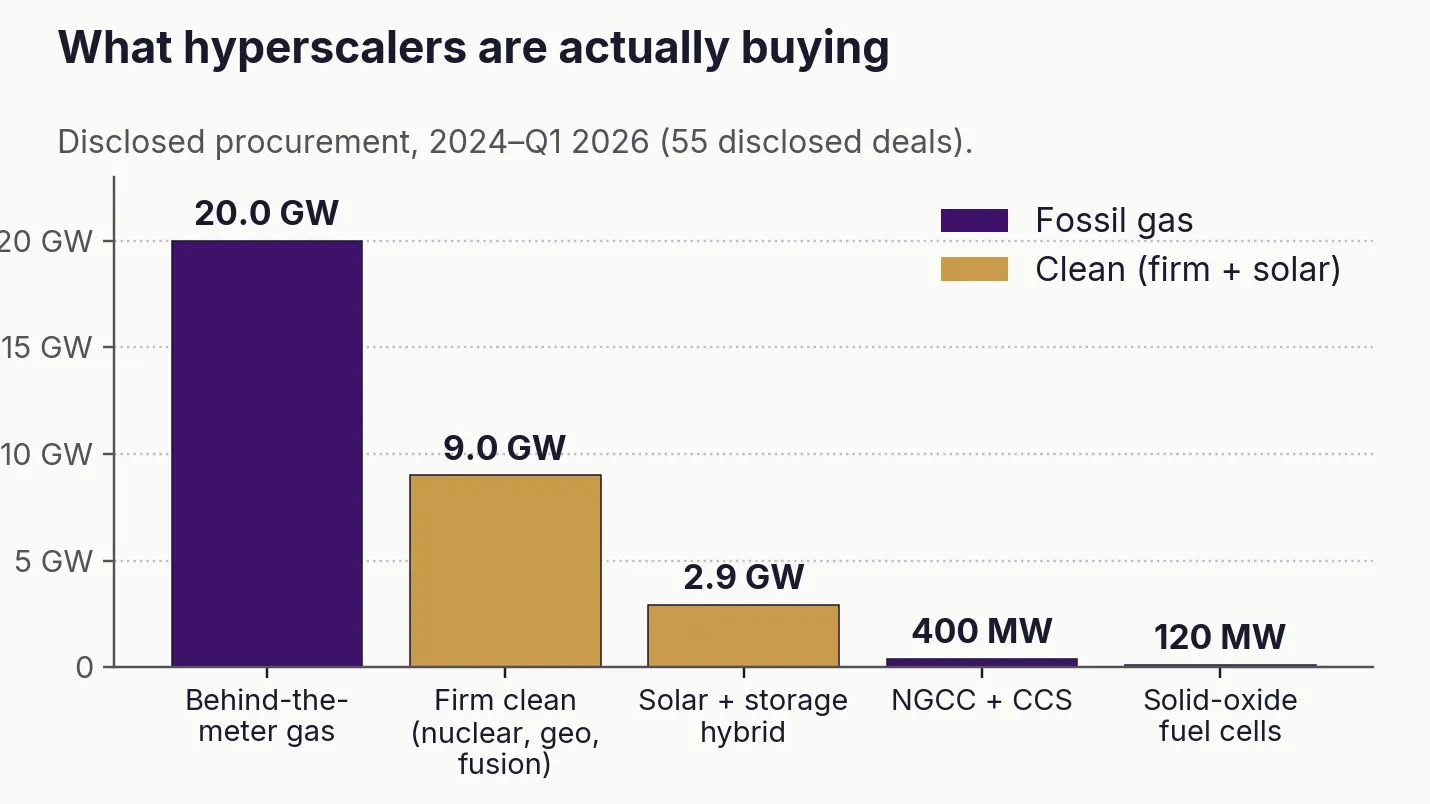
Start with what the operators are choosing. Over the last twenty-four months, hyperscalers have disclosed about 20 gigawatts of behind-the-meter gas — generation built on-site, beside the data center, bypassing the public grid — compared to roughly 9 to 10 gigawatts of firm, clean power contracted. Gas is winning by about two to one. The reason isn’t that these companies prefer it. Most have made prominent clean-energy commitments: Google’s pledge to run on 24/7 carbon-free energy by 2030, Microsoft’s carbon-negative target, Amazon’s and Meta’s net-zero goals. The gas build openly strains those commitments rather than honoring them. It’s happening anyway because gas is the cheapest power that can, in many places, be delivered in twenty-four months, and right now speed is the only thing that matters.
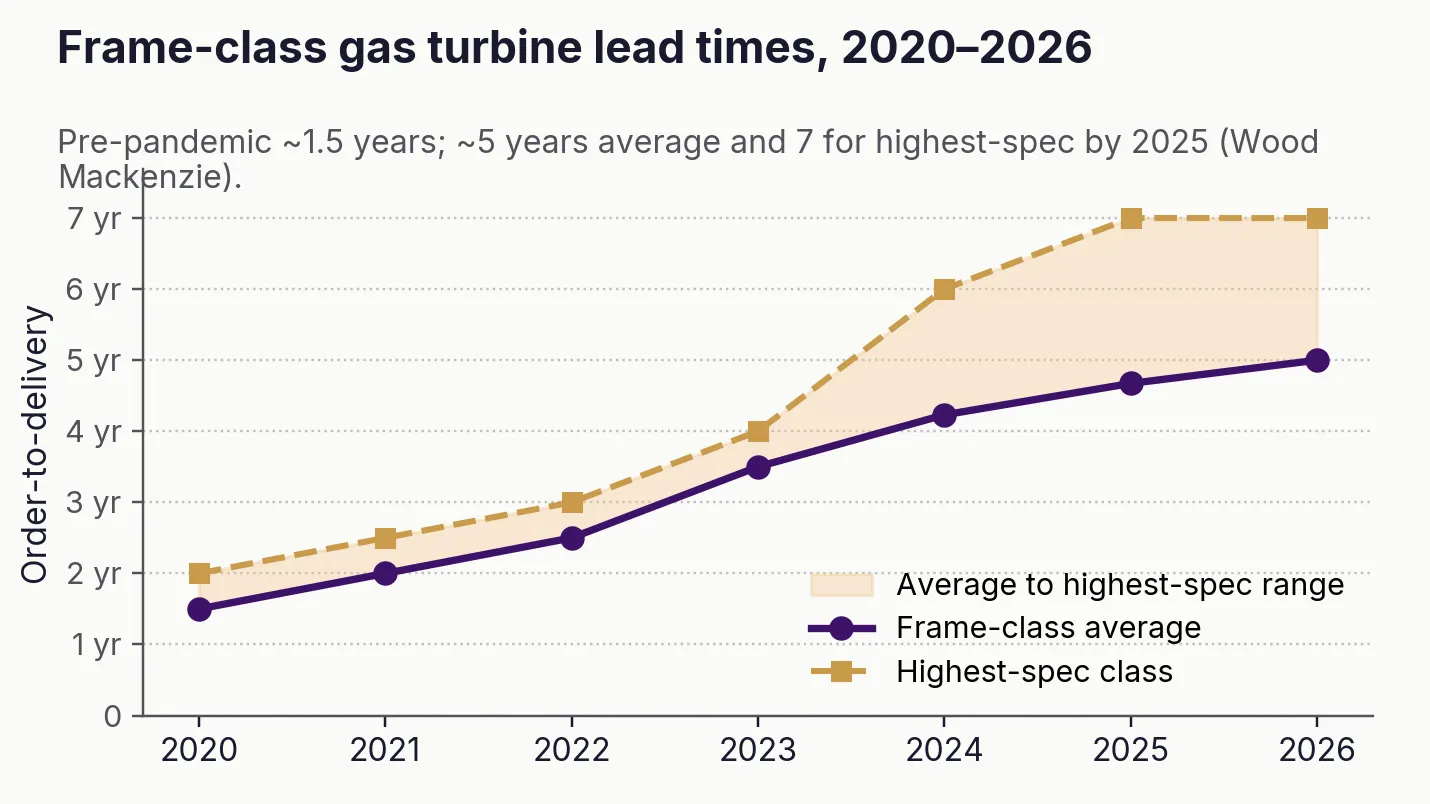
Here’s the catch: the gas turbines are sold out. Frame-class turbine lead times, which sat near eighteen months before the pandemic, have stretched to five-to-seven years, with the highest-spec frames quoting seven. The bottleneck isn’t the foundry’s willingness to build; it’s that these machines depend on single-crystal turbine blades and their stationary counterparts, their nozzle guide vanes — components that are extraordinarily difficult to manufacture, with only a handful of qualified suppliers in the world. The same scarcity has spread to the gear that connects the turbine to the rack. Transformer lead times reached 128 weeks in 2025. You can’t order your way out of this quickly, because the supply chain that would let you was sized for a slower world.
Nuclear is the other thing operators are buying, and it arrives in two flavors. The first is restarting and uprating existing reactors like Three Mile Island, Palisades, and Duane Arnold. This is the fastest path to clean firm power there is, capped only by the small inventory of units that can plausibly come back. The second is the new fleet: Meta, Amazon, and Google have signed for advanced reactors and small modular reactors from TerraPower, Oklo, X-energy, and Kairos, committing capital before a single commercial unit has been licensed in the United States. Those deals are real, and they’re large, but they’re on track to deliver in the 2030s rather than this decade, at first power, not at fleet scale, and only if licensing and supply chains cooperate. Further out still is fusion: pre-commercial today, but has drawn serious private capital on the wager that it ends the scarcity rather than merely easing it. The pattern across all three is the same. The clean firm options with the most headroom are precisely the ones that aren’t quite ready, which is why the near-term gap keeps falling to gas.
Well, you might say, isn’t solar the obvious answer? It is, after all, the cheapest electricity humanity has ever built. Modules clear about ten cents a watt leaving the factory, and solar paired with a few hours of battery storage prices into data-center contracts at $70 to $100 per megawatt-hour. The trouble though, is twofold.
The first problem is where the panels come from. A finished panel is the last step in a chain: purified polysilicon, then ingots and wafers, then cells, then the assembled module. China now controls nearly all of it: ~94 percent of the world’s polysilicon and ~97 percent of its wafers, the thin silicon discs every panel is built on. You can do the final assembly in Texas or Vietnam, but it is almost certainly sitting on a Chinese wafer. A large share of that chain traces back to Xinjiang, where cheap coal power made polysilicon cheap to produce, and where the United States now presumes, under the 2022 Uyghur Forced Labor Prevention Act, that goods are made with forced labor and bars them from import unless the buyer proves otherwise. This isn’t a theoretical risk. Since 2022, US Customs has stopped more than 16,000 shipments worth almost $4 billion, with solar the single largest category; in early 2025 it added Chinese wafer and ingot makers to the banned list, reaching past polysilicon into the wafers themselves. Hyperscalers have spent nearly four years trying to assemble a panel supply that avoids all this, and they have not really managed it, because you can move the assembly out of China but not the wafer underneath, and the genuinely clean alternatives are neither cheap enough nor abundant enough today to power a continent of data centers.
The second problem lies in intermittency. A battery sized to a single project — four hours, even eight — does eventually run dry, and an AI campus needs to stay powered for days regardless of weather. However, that’s a project-design limit, not a law of physics. Oversize the solar field to several times the transmission line it feeds, pair it with enough storage to keep that line full, and you can deliver genuinely firm, around-the-clock power. IRENA’s 2026 analysis of firm solar and wind puts solar-plus-storage at roughly $54–82 per megawatt-hour in high-quality resource regions (below the $100-plus of new gas) and falling perhaps another 30 percent by 2030. The catch is geography: those figures are for high-irradiance sites, which in practice means outside the United States, where build costs run higher. So the real constraints on solar-as-firm-power are where the sun reliably shines and where the panels can be sourced, not the physics of storage duration. The long-duration chemistries — 100-hour iron-air, vanadium flow, sulfur, carbon-dioxide cycles, compressed air — extend that envelope into cloudier places; several are at or near their first commercial installations, but there is a long road from there to the gigawatts per year this demand would require. A stranger route skips terrestrial storage altogether: collect the sunlight in geosynchronous orbit, where it never sets, and beam it down to firm an array on the ground. It reads like science fiction, but Overview Energy, is building exactly that.
One assumption underneath all of this deserves scrutiny: that an AI campus needs firm, around-the-clock power. Training, unlike inference, is interruptible, and several hyperscalers are exploring curtailable and time-shifted load, running flat out when power is cheap, and easing off when it’s not. If a meaningful share of AI demand can flex, the firm requirement softens and cheap intermittent power covers more of it. We think this helps at the margin, but not the overall picture. Inference is the part that grows as AI is actually deployed, and it is latency-sensitive and far less interruptible; the economics of a multi-billion-dollar data center disincentivize idling it. The clearest evidence is what the operators are signing: firm contracts, not interruptible ones. Flexibility shaves the peak demand, but doesn’t lower the floor.
So the near-term answer is gas where it can be built, reactor restarts where they exist, and solar-plus-storage where the grid and the sourcing allow. None of it is enough. To see why, and to see what comes next, we have to look at the full menu — what each alternative option costs, and where on the planet it can actually be built.
3. What it costs
The standard yardstick for power is the levelized cost of electricity, or LCOE: a plant’s total lifetime cost divided by all the electricity it produces, in dollars per megawatt-hour. It’s how the industry puts a solar farm and a gas turbine on the same axis. But it has a blind spot. LCOE counts every megawatt-hour as identical, whether it shows up at noon on a sunny day or at 3 a.m. in a January cold snap. To a grid or data center that can’t pause, those aren’t the same product.
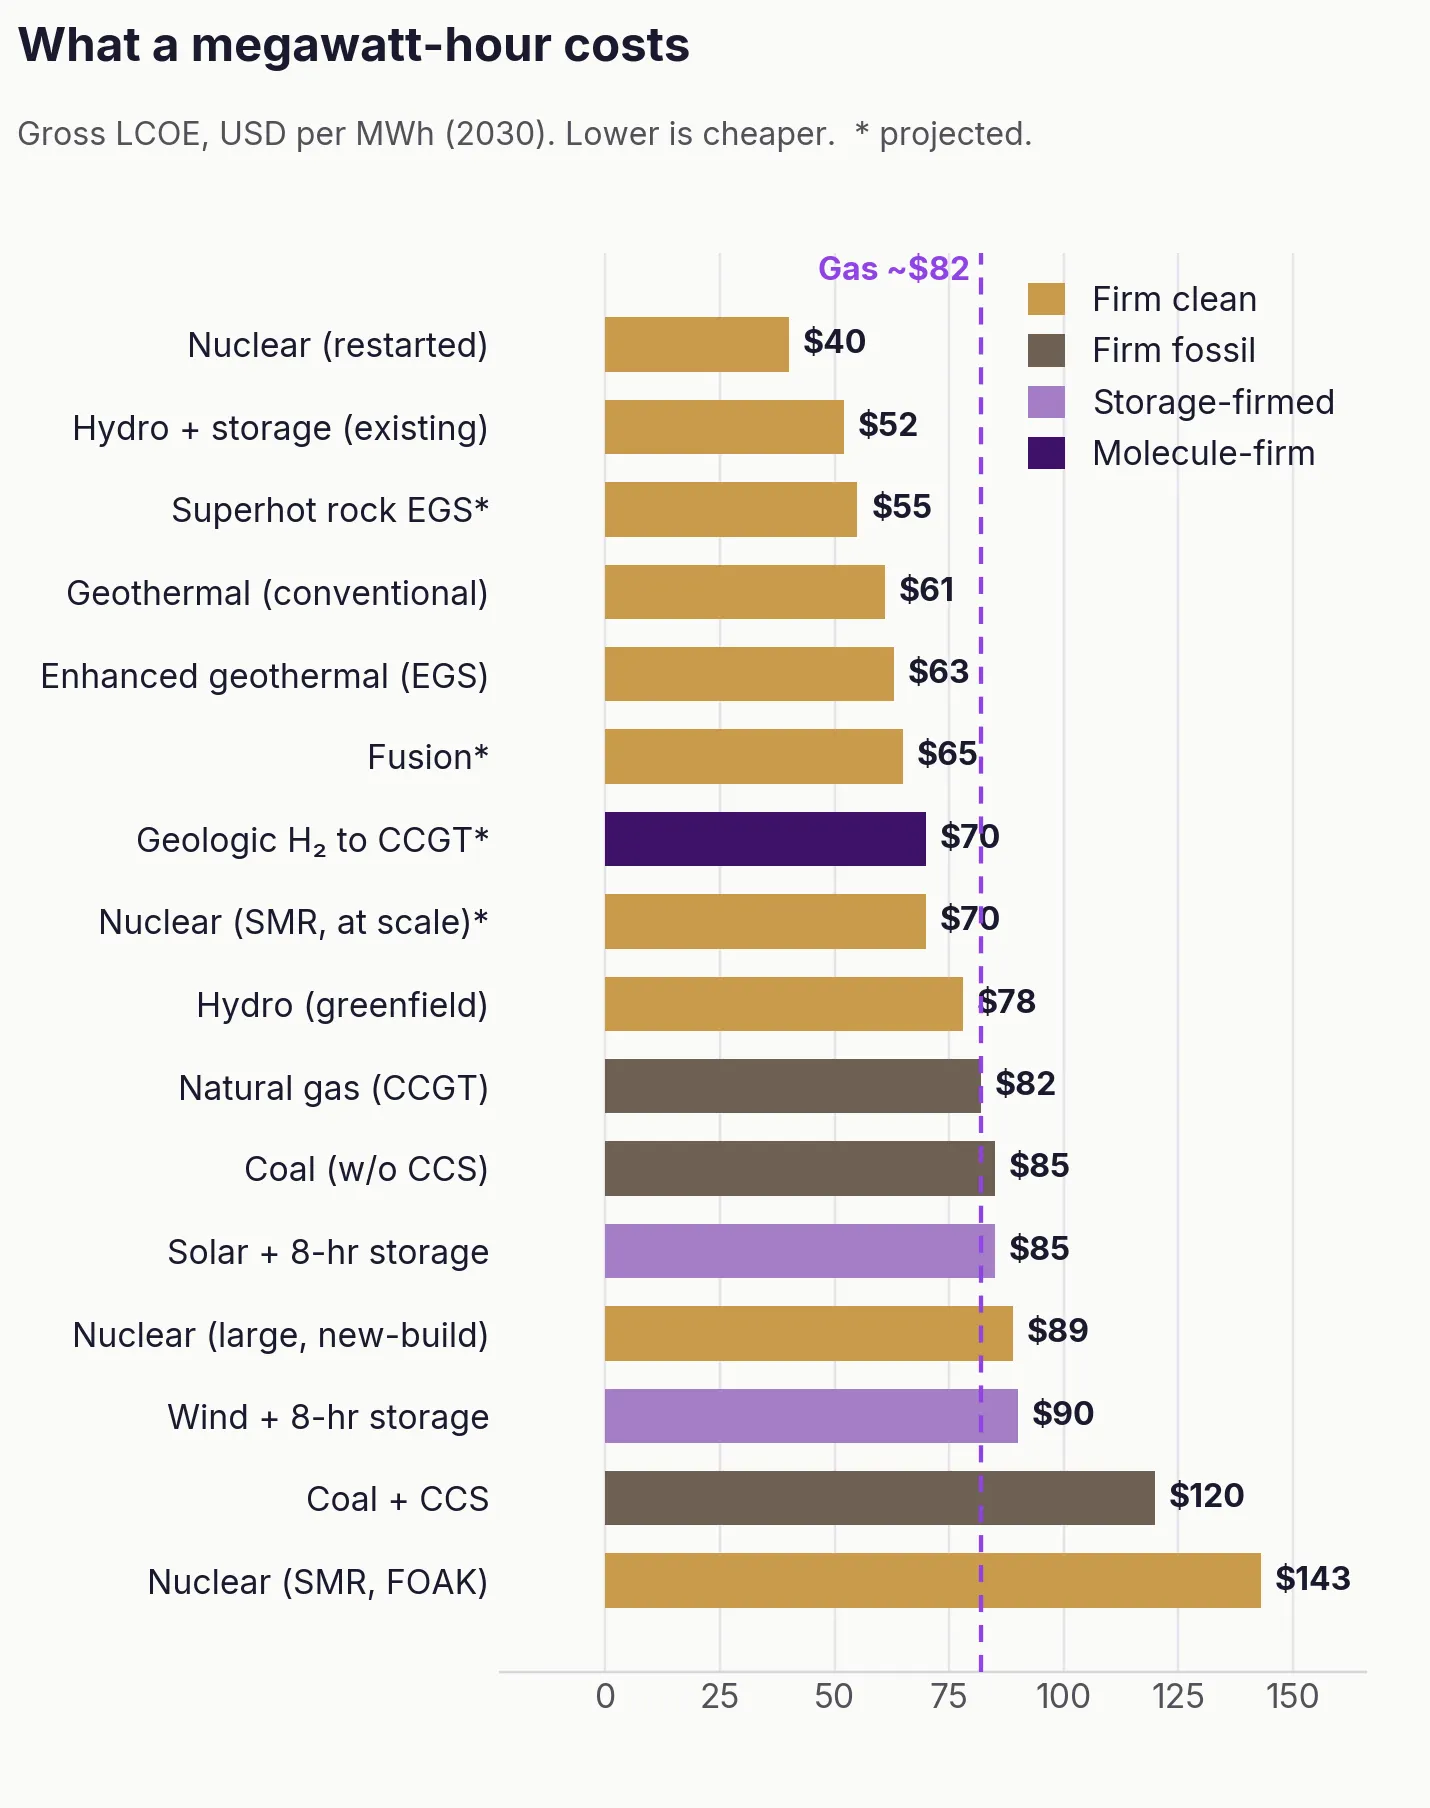
To capture this, we make an adjustment: credit each source for the system costs that firmness avoids — backup capacity, grid stability, and integrating intermittent supply.
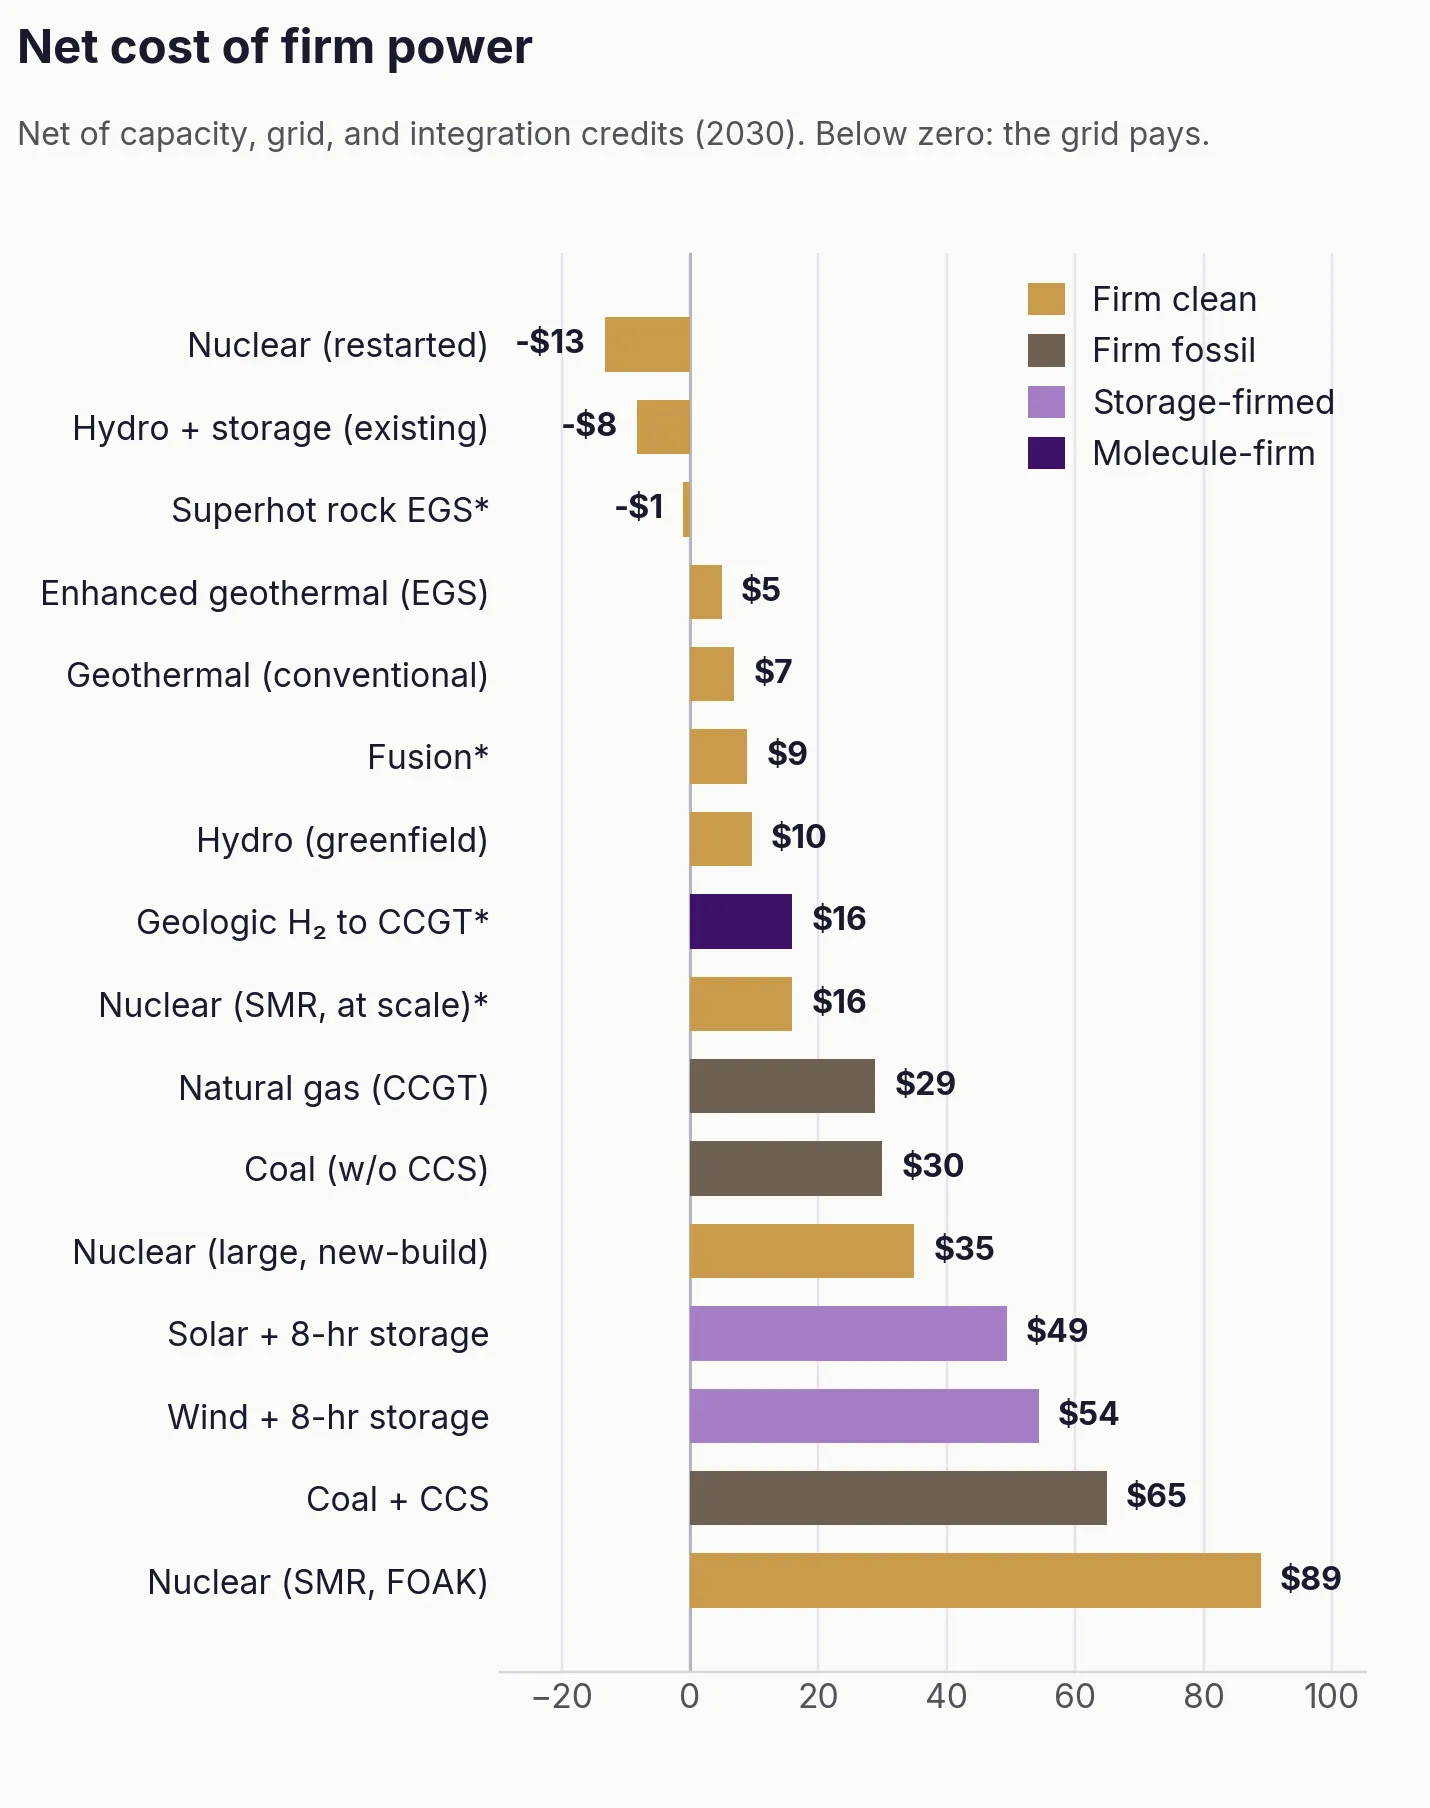
Treat the net column as a direction, not a settled price. The three credits — drawn from PJM’s 2026/27 capacity auction, the regional market monitor, and the integration literature — rest on assumptions reasonable people will likely contest, and the negative numbers mean "the grid should pay to have this," not "free power." But the direction holds: price firmness honestly and the gap between clean firm power and gas narrows, then inverts for certain methods of generation.
4. Where it can be built
Cost tells you what to build and geography tells you where. A gas turbine can go almost anywhere, but the clean firm sources that can replace it are regionally variable. One limiter is physical: where the heat, the sun, the wind, and the right rock actually sit, fixed by geology and planetary physics. The other is regulatory: where a project can be licensed, leased, and connected to the grid. The maps below are an attempt to display both.
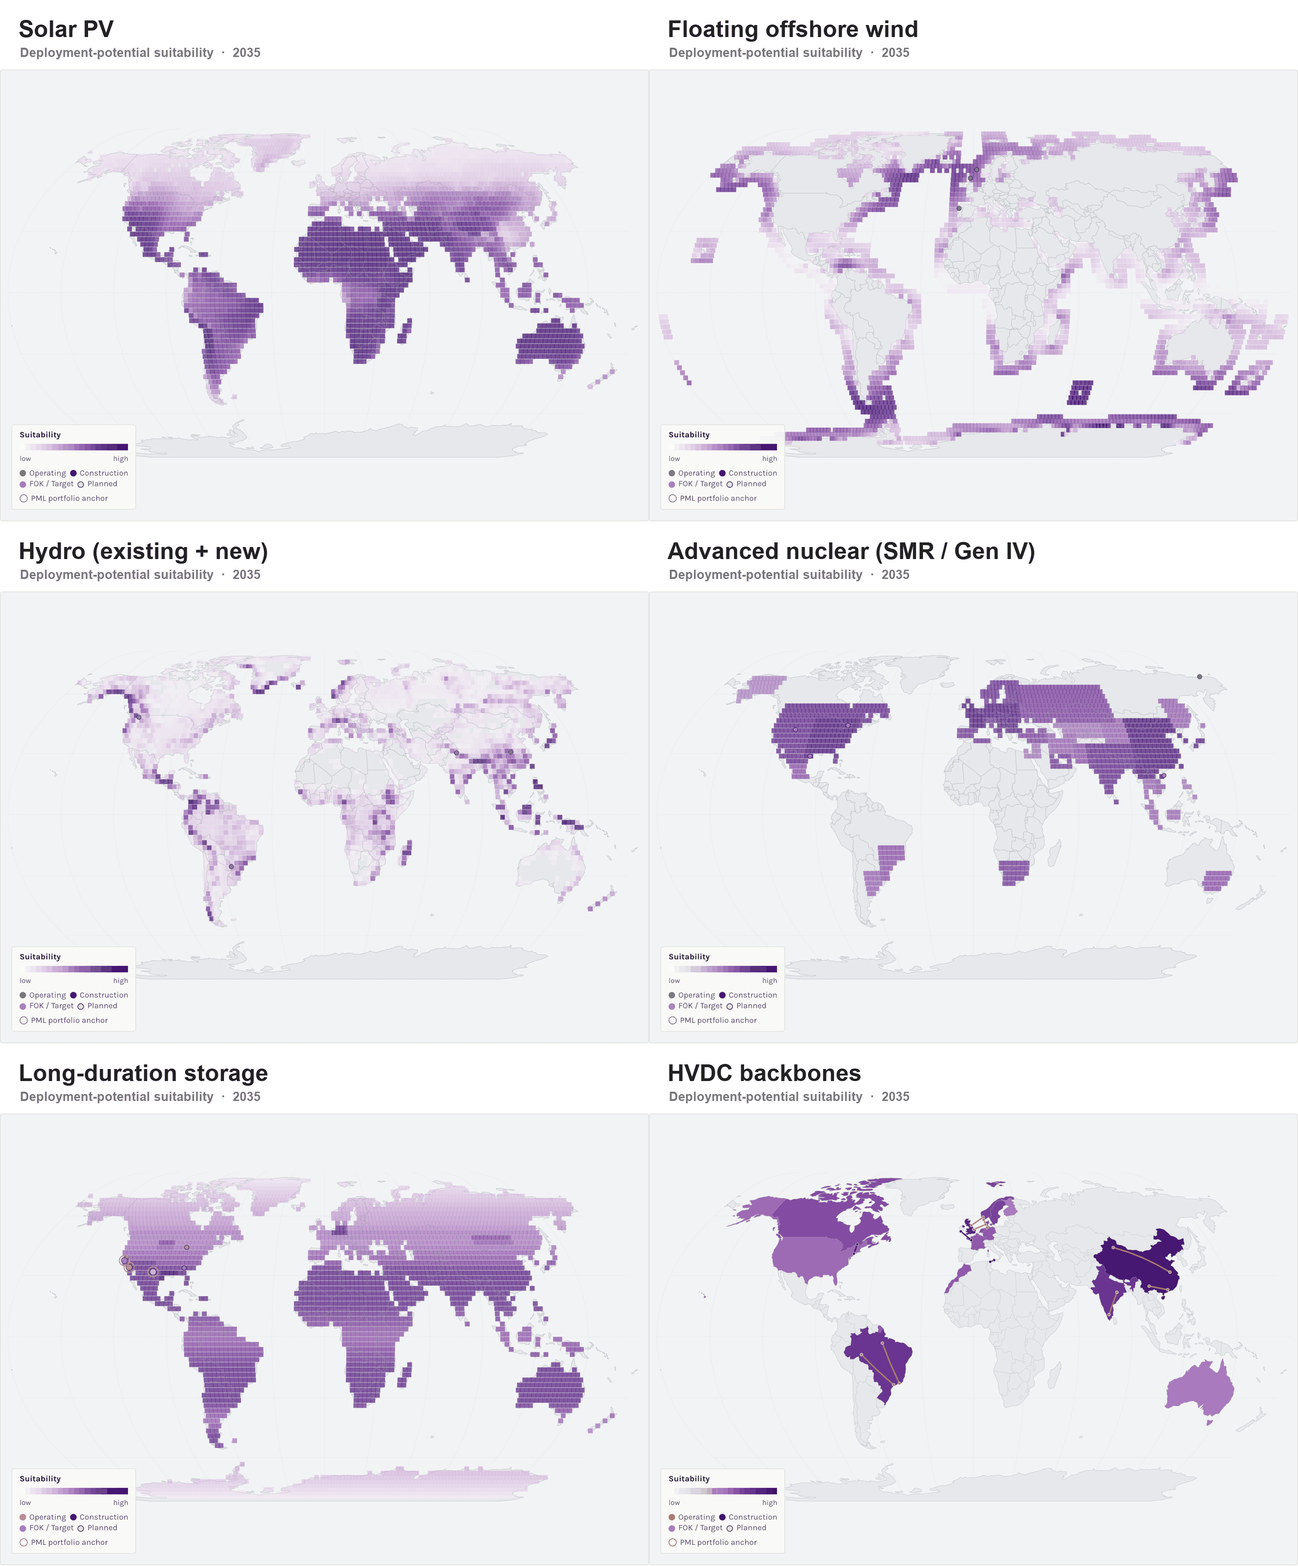
Read together, the maps make one point: clean firm resources are abundant but unevenly placed. What’s often missing is not the resource, but the equipment to exploit it at scale, and increasingly the wires to move it.
5. When does meaningful capacity arrive?
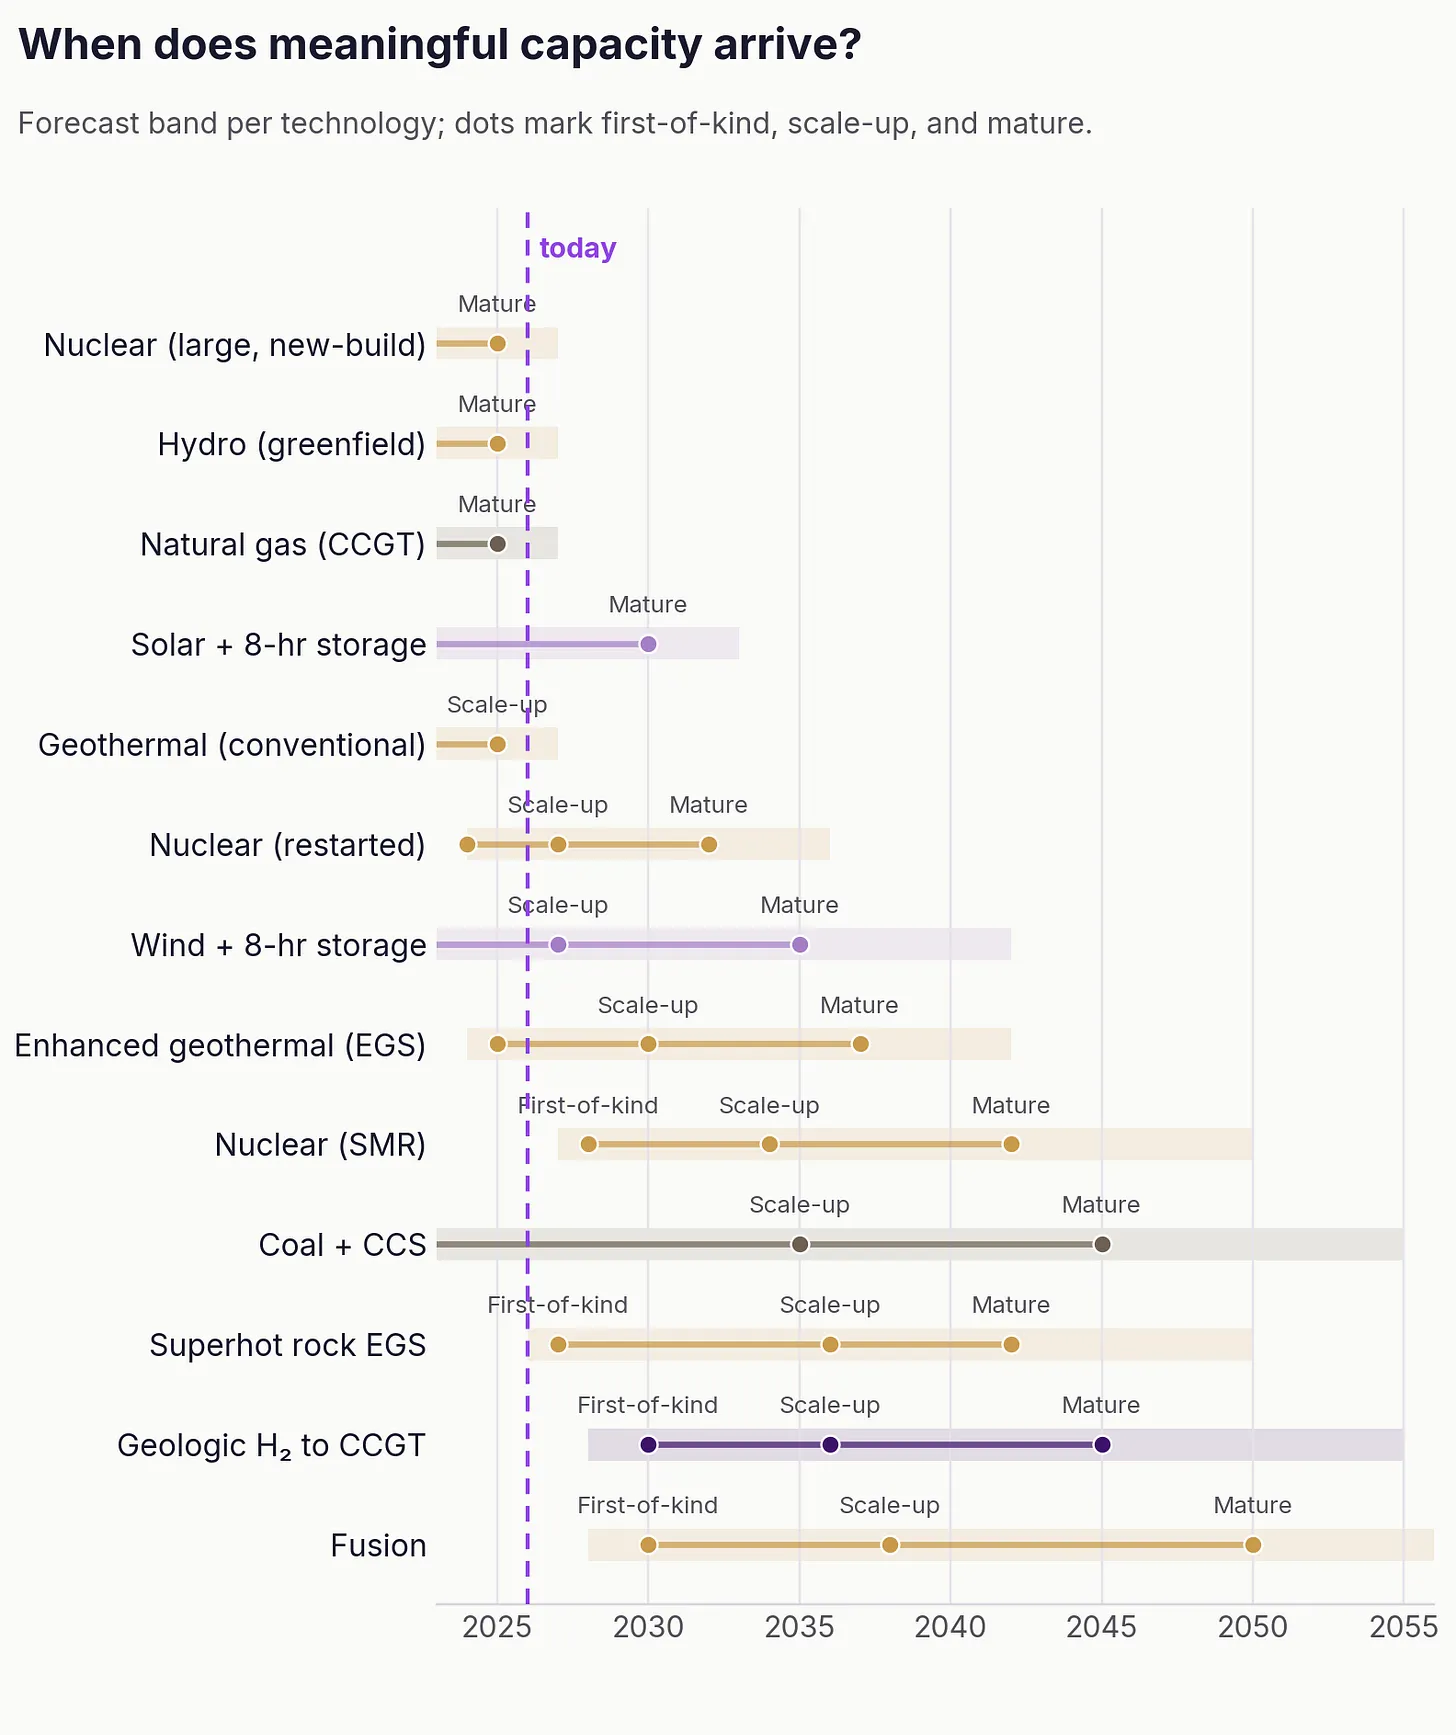
Think of the next twenty-five years in three windows. The first, roughly 2026 to 2030, belongs to whatever can ship at multi-gigawatt scale in the next forty-eight months. This means behind-the-meter gas, reactor restarts and uprates, solar with four-hour storage. The clean firm technologies are at their first-of-a-kind demonstrations and pilot build-outs.
The second window, roughly 2030 to 2035, is when those demonstrations either become fleets or do not. This is when superhot geothermal, advanced fission, and the first small-modular-reactor deployments reach meaningful scale. It’s also when fusion’s experimental clock either clears its engineering scale-up and execution gate or it doesn’t.
The third window, 2035 to 2050, is the scale-up for everything that cleared its gate in the second. The earliest year in which cumulative new firm clean supply exceeds operator-side demand falls somewhere between 2038 and 2045. The gap between what AI wants and what clean firm power can deliver stays open into the 2040s, and every year a first-of-a-kind slips, it stays open a year longer. Those slips are as often regulatory as technical. Reactor licensing, geothermal leasing, and grid interconnection all move through queues built for a handful of projects a year rather than a fleet, so the binding constraint is becoming administrative more than technological. This is not pessimism but arithmetic, and it is why the near-term gas build is happening whether anyone likes it or not.
One implication of that timeline is financial, not technical. The first-of-a-kind projects and scaling that could pull the crossover earlier — the first superhot wells or the first advanced-reactor units, carry their heaviest risk at the very front, before anything is proven. A subsurface resource in particular has to be de-risked before it can be drilled out at scale, and that first-unit risk is more concentrated and longer-dated than any single source of capital is built to carry on its own.
This is where public capital earns its highest return. The most valuable dollar in the system is the one that retires the risk on a first unit, through loan guarantees, milestone-based offtake, and first-of-a-kind cost-sharing, because it is the dollar that unlocks every private dollar behind it. Far more of it should be flowing, and aimed squarely at the first units rather than the fleet. Once a design is proven, private capital moves quickly and at scale and needs no help. The fastest way to pull the crossover out of the 2040s is not a new technology; it is public balance sheets retiring first-unit risk so private capital can build what works.
6. The work, and who is doing it
If the gap stays open into the 2040s, the useful response is not to despair about it but to ask what has to be built to close it sooner, and to back the people building it. Some of that work is already underway, including at some of our portfolio companies. Commonwealth Fusion Systems is at the magnetic-confinement physics gate at its Devens, MA campus, with a commercial demonstration anchored by Google. Focused Energy is pursuing a different path to fusion: laser-driven proton fast ignition. Its remaining gate is engineering scale-up and execution, not the underlying physics, which its approach has already demonstrated. Polpis Systems is drilling toward the 400-degree-plus superhot rock that would unlock that continental-scale map. Lyten is working the lithium-sulfur chemistry that gets storage past the four-hour wall. Overview Energy is trying to make solar a firm resource without batteries, by collecting sunlight in geosynchronous orbit, where the sun never sets, and beaming it down to terrestrial solar farms when they would otherwise go dark; it recently signed its first agreement with Meta, for up to a gigawatt.
The more useful list is of the things no one we know has solved yet: lithium-7 enrichment; two-phase dielectric cooling fluids; pressure-rated heat exchangers for volcanic brine above 280 degrees; flow assurance for geologic hydrogen at commercial well rates. Each of these is specific, and on someone’s critical path right now.
Sources & Methods
Demand
Historical generation is from the EIA Annual Energy Review (United States) and from Ember and the Energy Institute Statistical Review of World Energy (rest of world). The forward range corrects the published outlooks — IEA, EIA, BloombergNEF, and Wood Mackenzie — for each forecaster’s own documented record of revising its projections upward over successive editions. The bottom-up figures are a direct tally of the disclosed offtake agreements, reactor restarts, and behind-the-meter projects cited throughout this piece (55 deals, 2024–Q1 2026) — the same data behind the procurement chart. The 2035 data-center estimate of 2,125 TWh is set against the IEA base case of 1,200 TWh.
Cost
Gross LCOE is from Lazard’s LCOE+ (2024 edition). Points marked projected are developer at-scale targets rather than realized costs, and should be read as forward estimates. The firmness credits behind the net figure are derived from the PJM 2026/27 Base Residual Auction clearing price, Monitoring Analytics’ State of the Market report for PJM, and the published grid-integration literature.
Geography
Most layers are measured fields: heat flow from the IHFC Global Heat Flow Database, geologic-hydrogen prospectivity from published ophiolite and cratonic surveys, and solar and wind from NASA POWER and reanalysis climatology. Two carry caveats: the floating offshore-wind layer measures wind but not water depth at this grid scale (read it as “where the wind is strong near shore”), and the hydro layer is a model of rainfall times terrain relief, not a measured potential. A second set of layers — advanced fission, storage duration, coal-plant repowering, grid interconnection — are our own synthesis rather than measurement, and are kept to the interactive version.
Lead times
Gas-turbine and transformer order-to-delivery times are from Wood Mackenzie (2021–2026), S&P Global Platts (2025), and Utility Dive (2026).
Timeline
Phase years are drawn from DOE Advanced Reactor Demonstration Program milestones, NRC docket filings, and developer disclosures; the band around each reflects our reading of those filings, not a proprietary model.